


How do I export and read my Dashboard reports?
Filter by date and organization, read each metric, and export a CSV you can share.
Your Dashboard shows how learners are using Transfr — how many are active, how many sims or careers they've completed, and how they're scoring. You can filter the view by date and organization, read the summary tiles for each product, and export the data to a spreadsheet to share or keep. This article covers where your reports live, how to filter them, what each number means, and how to export.
Find your reports
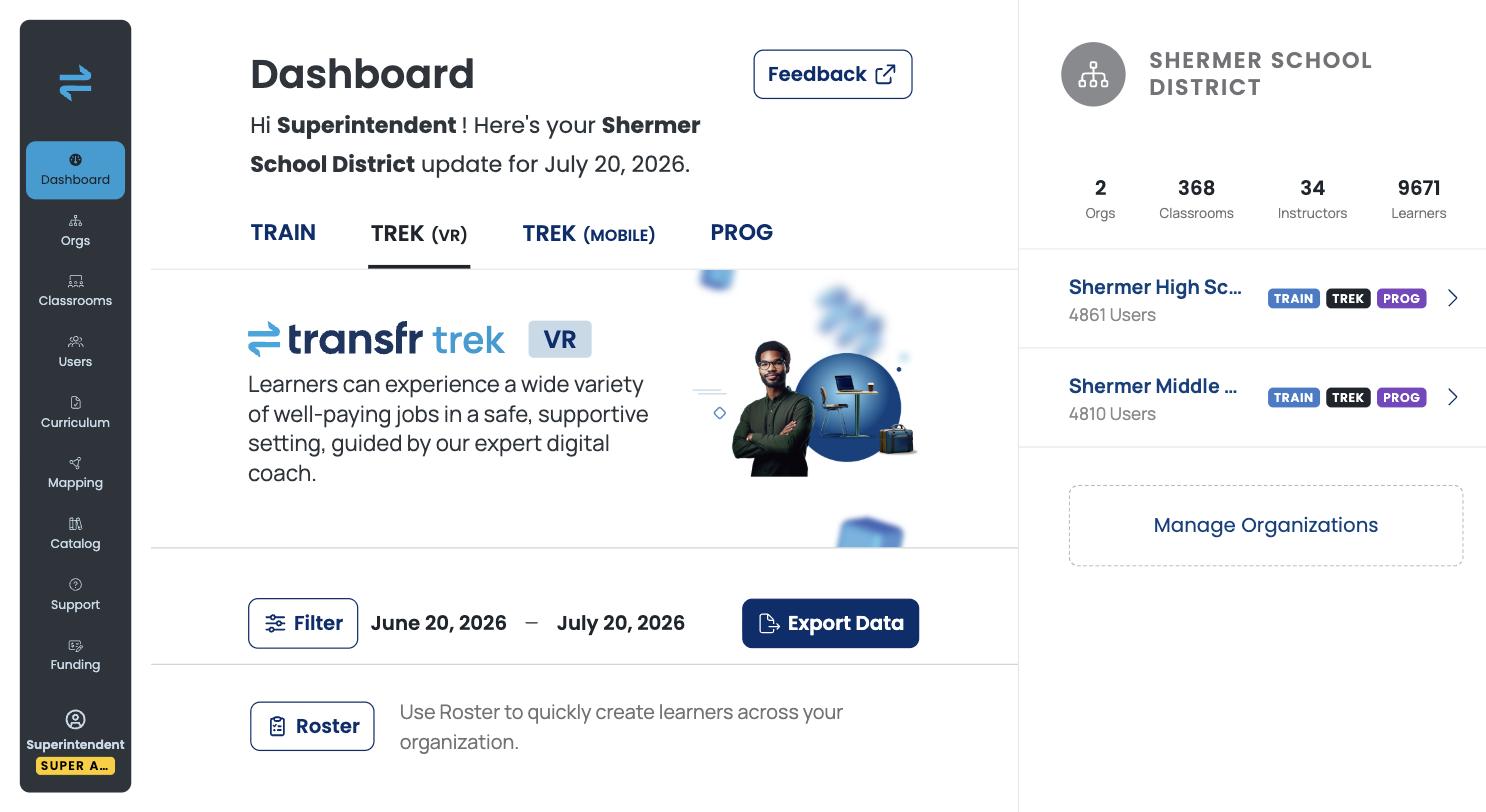
- In the left menu, select Dashboard.
- At the top of the report, select the product you want to see: Train, Trek (VR), Trek (Mobile), or Prog.
Each product tab shows its own set of metrics for the organization and time period you choose.
Filter by date range and organization
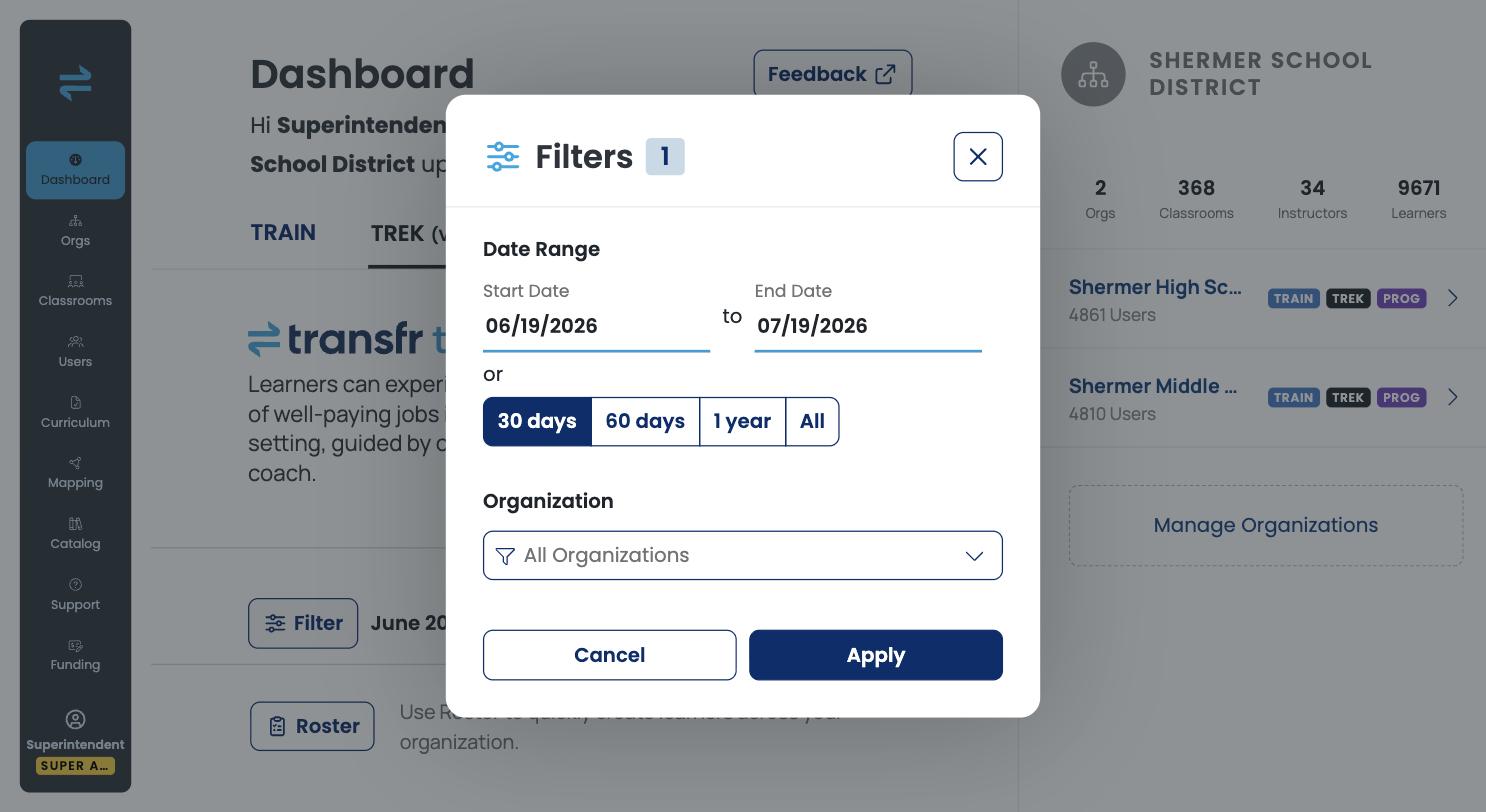
- Select Filter.
- Set a Start Date and End Date, or choose a quick range: 30 days, 60 days, 1 year, or All.
- (Optional) Under Organization, choose a specific school or sub-organization, or leave it on All Organizations.
- Select Apply.
The date range you picked shows next to the Filter button, and a number badge on Filter shows how many filters are active.
Seeing a dash (—) or "No data to display"? There's no activity for the product, organization, and dates you picked. Widen the date range or check the Organization filter.
Read the metrics
Each tile shows a number for the product tab and time period you selected. Hover the info icon on any tile to see its definition.
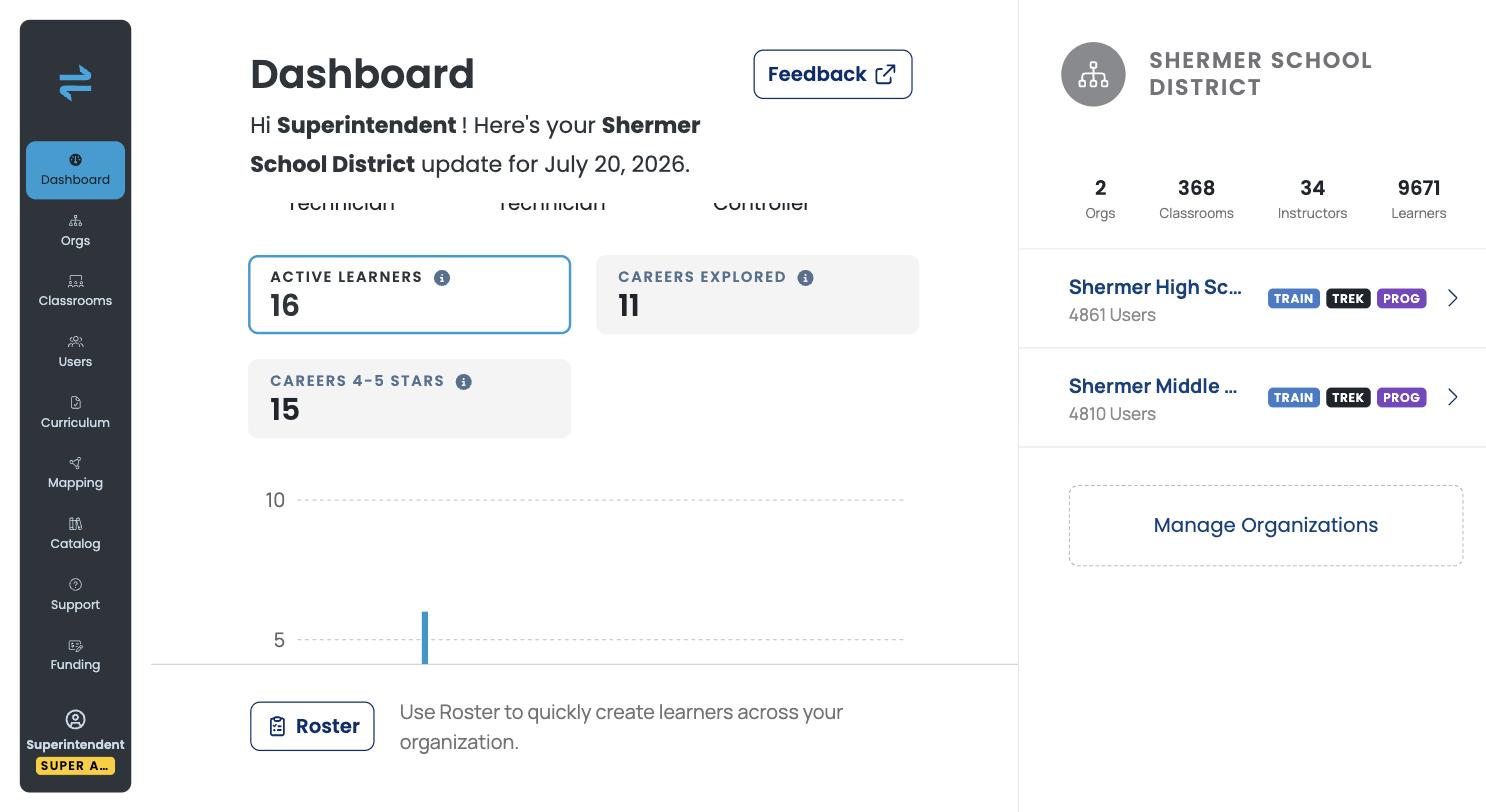
Trek (VR)
- Active Learners — Learners who have started at least one sim during the time period.
- Careers Explored — Number of careers learners completed.
- Careers 4-5 Stars — Number of careers that learners rate as 4 or 5 stars.
Train
- Active Learners — Learners who have started at least one sim during the time period.
- Sims Completed — Sims taken where learners have reached the end.
- Sims Mastered — Sims completed with scores of 90% or higher.
Why "Active Learners" is lower than your total learner count: the panel on the right lists every learner in your organization, while Active Learners counts only those who used Transfr during the time period you picked. To count more of them, widen the date range.
Export your data to a spreadsheet
- Set the product tab, date range, and organization you want to export.
- Select Export Data.
- Your browser downloads a CSV file named for your organization and date range (for example, Shermer School District Insights [06_20_26 - 07_20_26].csv). Open it in Excel or Google Sheets.
The CSV has one row per organization, with a column for each metric shown on the product tab you exported. For example, a Train export has the columns Organization, Active Learners, Sims Completed, and Sims Mastered.
Notes
- The panel on the right summarizes your whole organization: Orgs, Classrooms, Instructors, and Learners.
- Instructors see data for their own classrooms; Admins, Super Admins, and Reporters see the full organization.
- Data reflects what has synced from headsets and Trek Mobile, so recent activity can take time to appear.
Still need help?
Contact our support team.
