


Data & Reporting Guide
Where to find learner progress, what each metric means, and how to export your data to CSV.
The Transfr Dashboard shows learner progress at three levels: your whole organization, a single classroom, and an individual learner. This guide covers where each view lives, what the numbers on it mean, and how to get the data out as a spreadsheet.
If you only need the export, jump to Exporting to a CSV file.
Where to find your data
There are three places to look, from widest to narrowest:
- Dashboard (the first item in the left navigation) — totals across your whole organization, with a date filter.
- A classroom's Progress tab — how one classroom is doing, simulation by simulation.
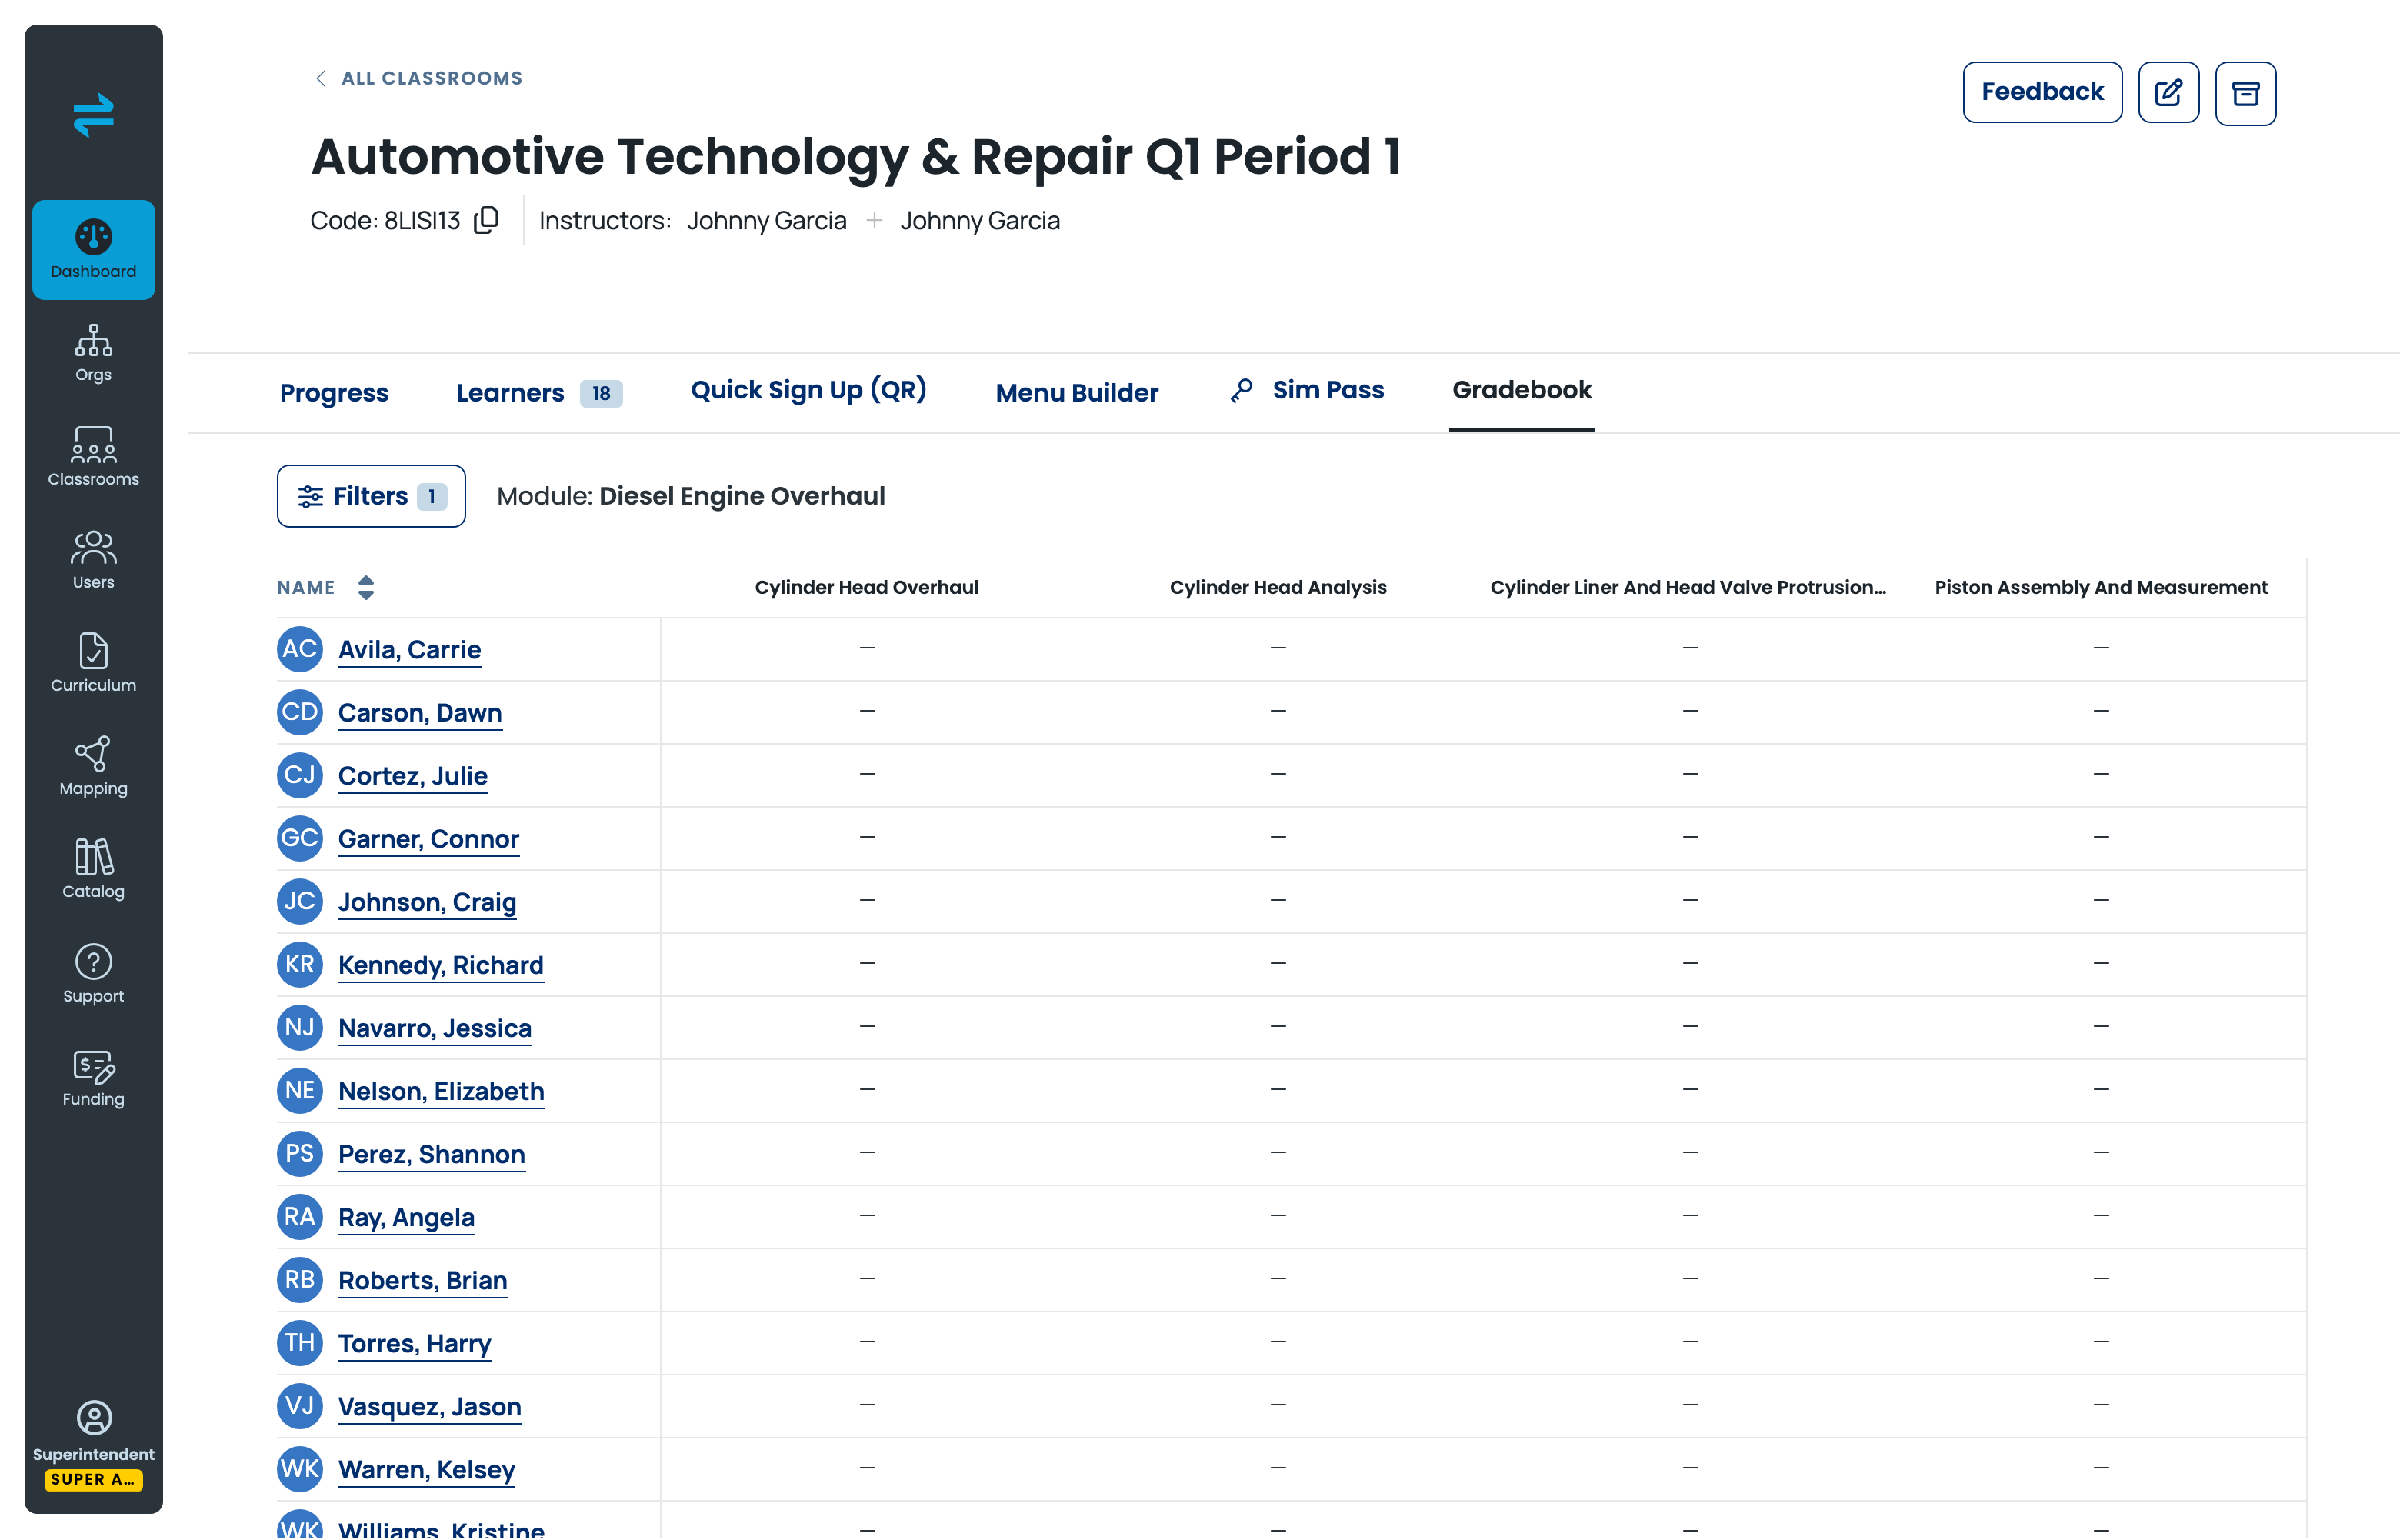
- A classroom's Gradebook tab — a grid of every learner against every simulation in a module.
All three can be exported to CSV.
Reading the Dashboard page
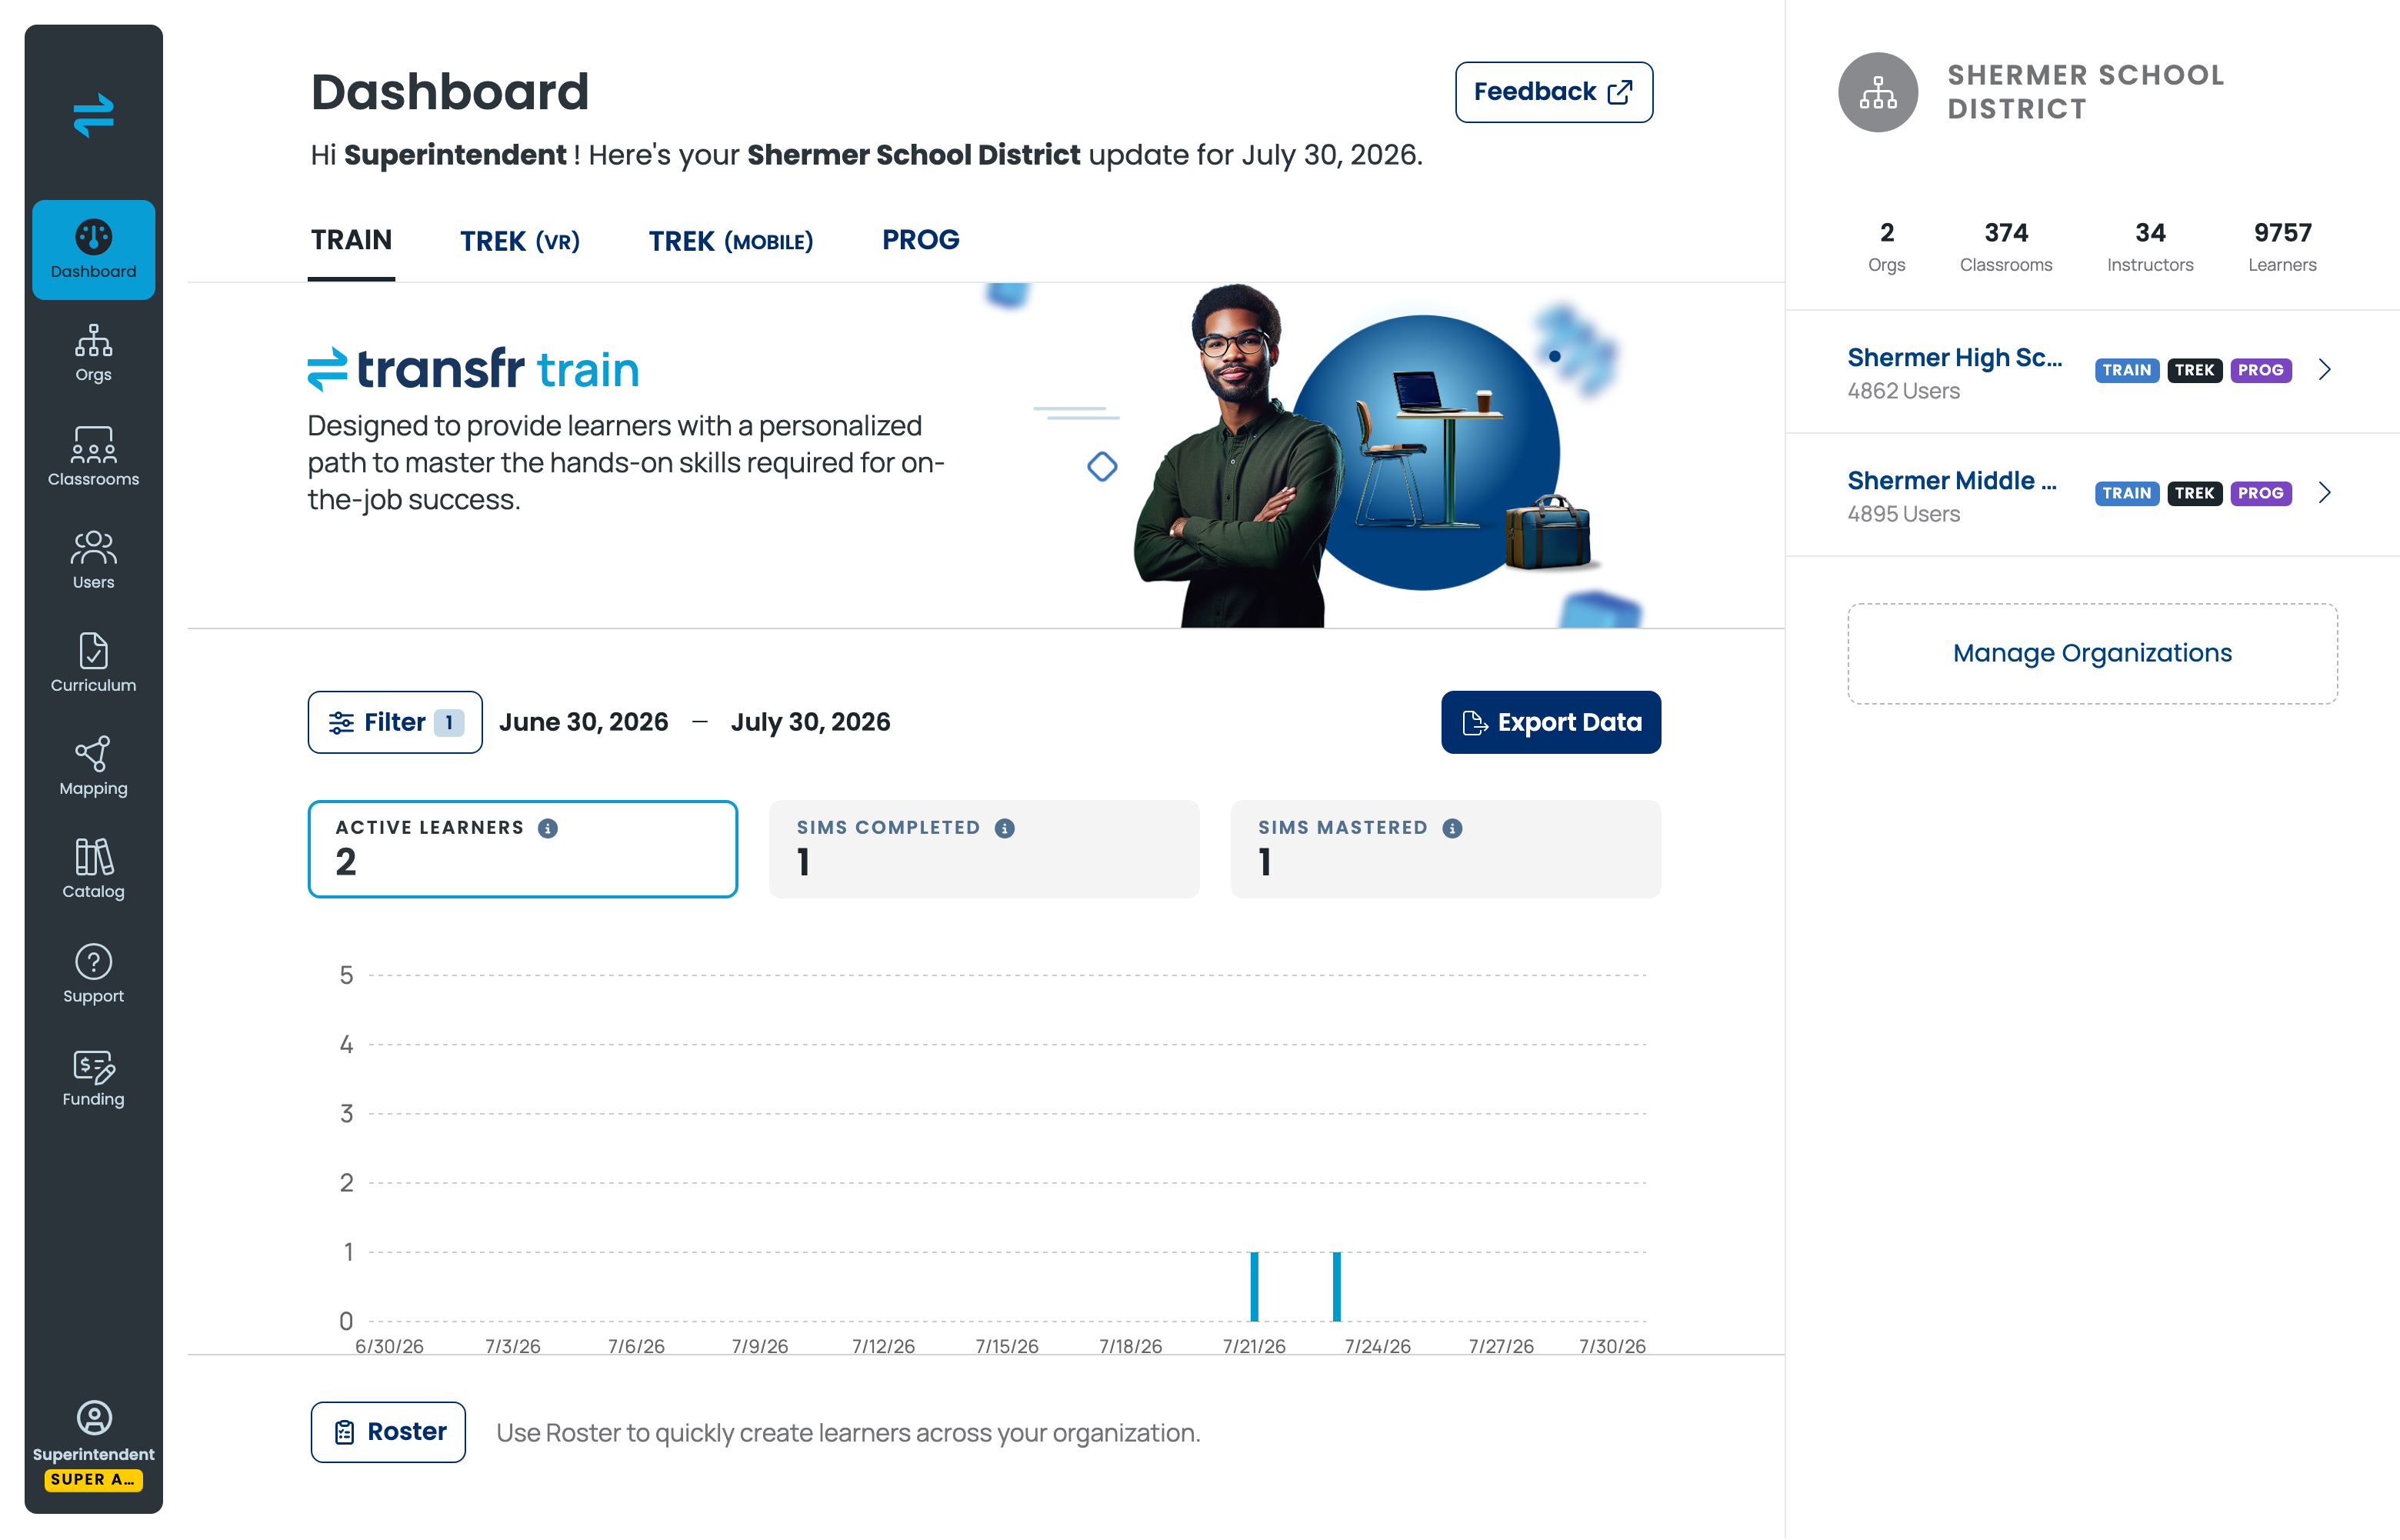
Select Dashboard in the left navigation. The page opens with a greeting and today's date, then a row of product tabs: TRAIN, TREK (VR), TREK (MOBILE), and PROG. You'll only see tabs for the products your organization has.
Each tab has its own set of summary tiles. On the TRAIN tab those are ACTIVE LEARNERS, SIMS COMPLETED, and SIMS MASTERED, followed by a chart of activity over the selected date range.
Below the chart:
- Roster — a shortcut for creating learners across your organization in bulk.
- Your organization totals: Orgs, Classrooms, Instructors, and Learners.
- A card per child organization, each showing its user count and which products it has.
- Manage Organizations — opens the Orgs area.
Changing the date range
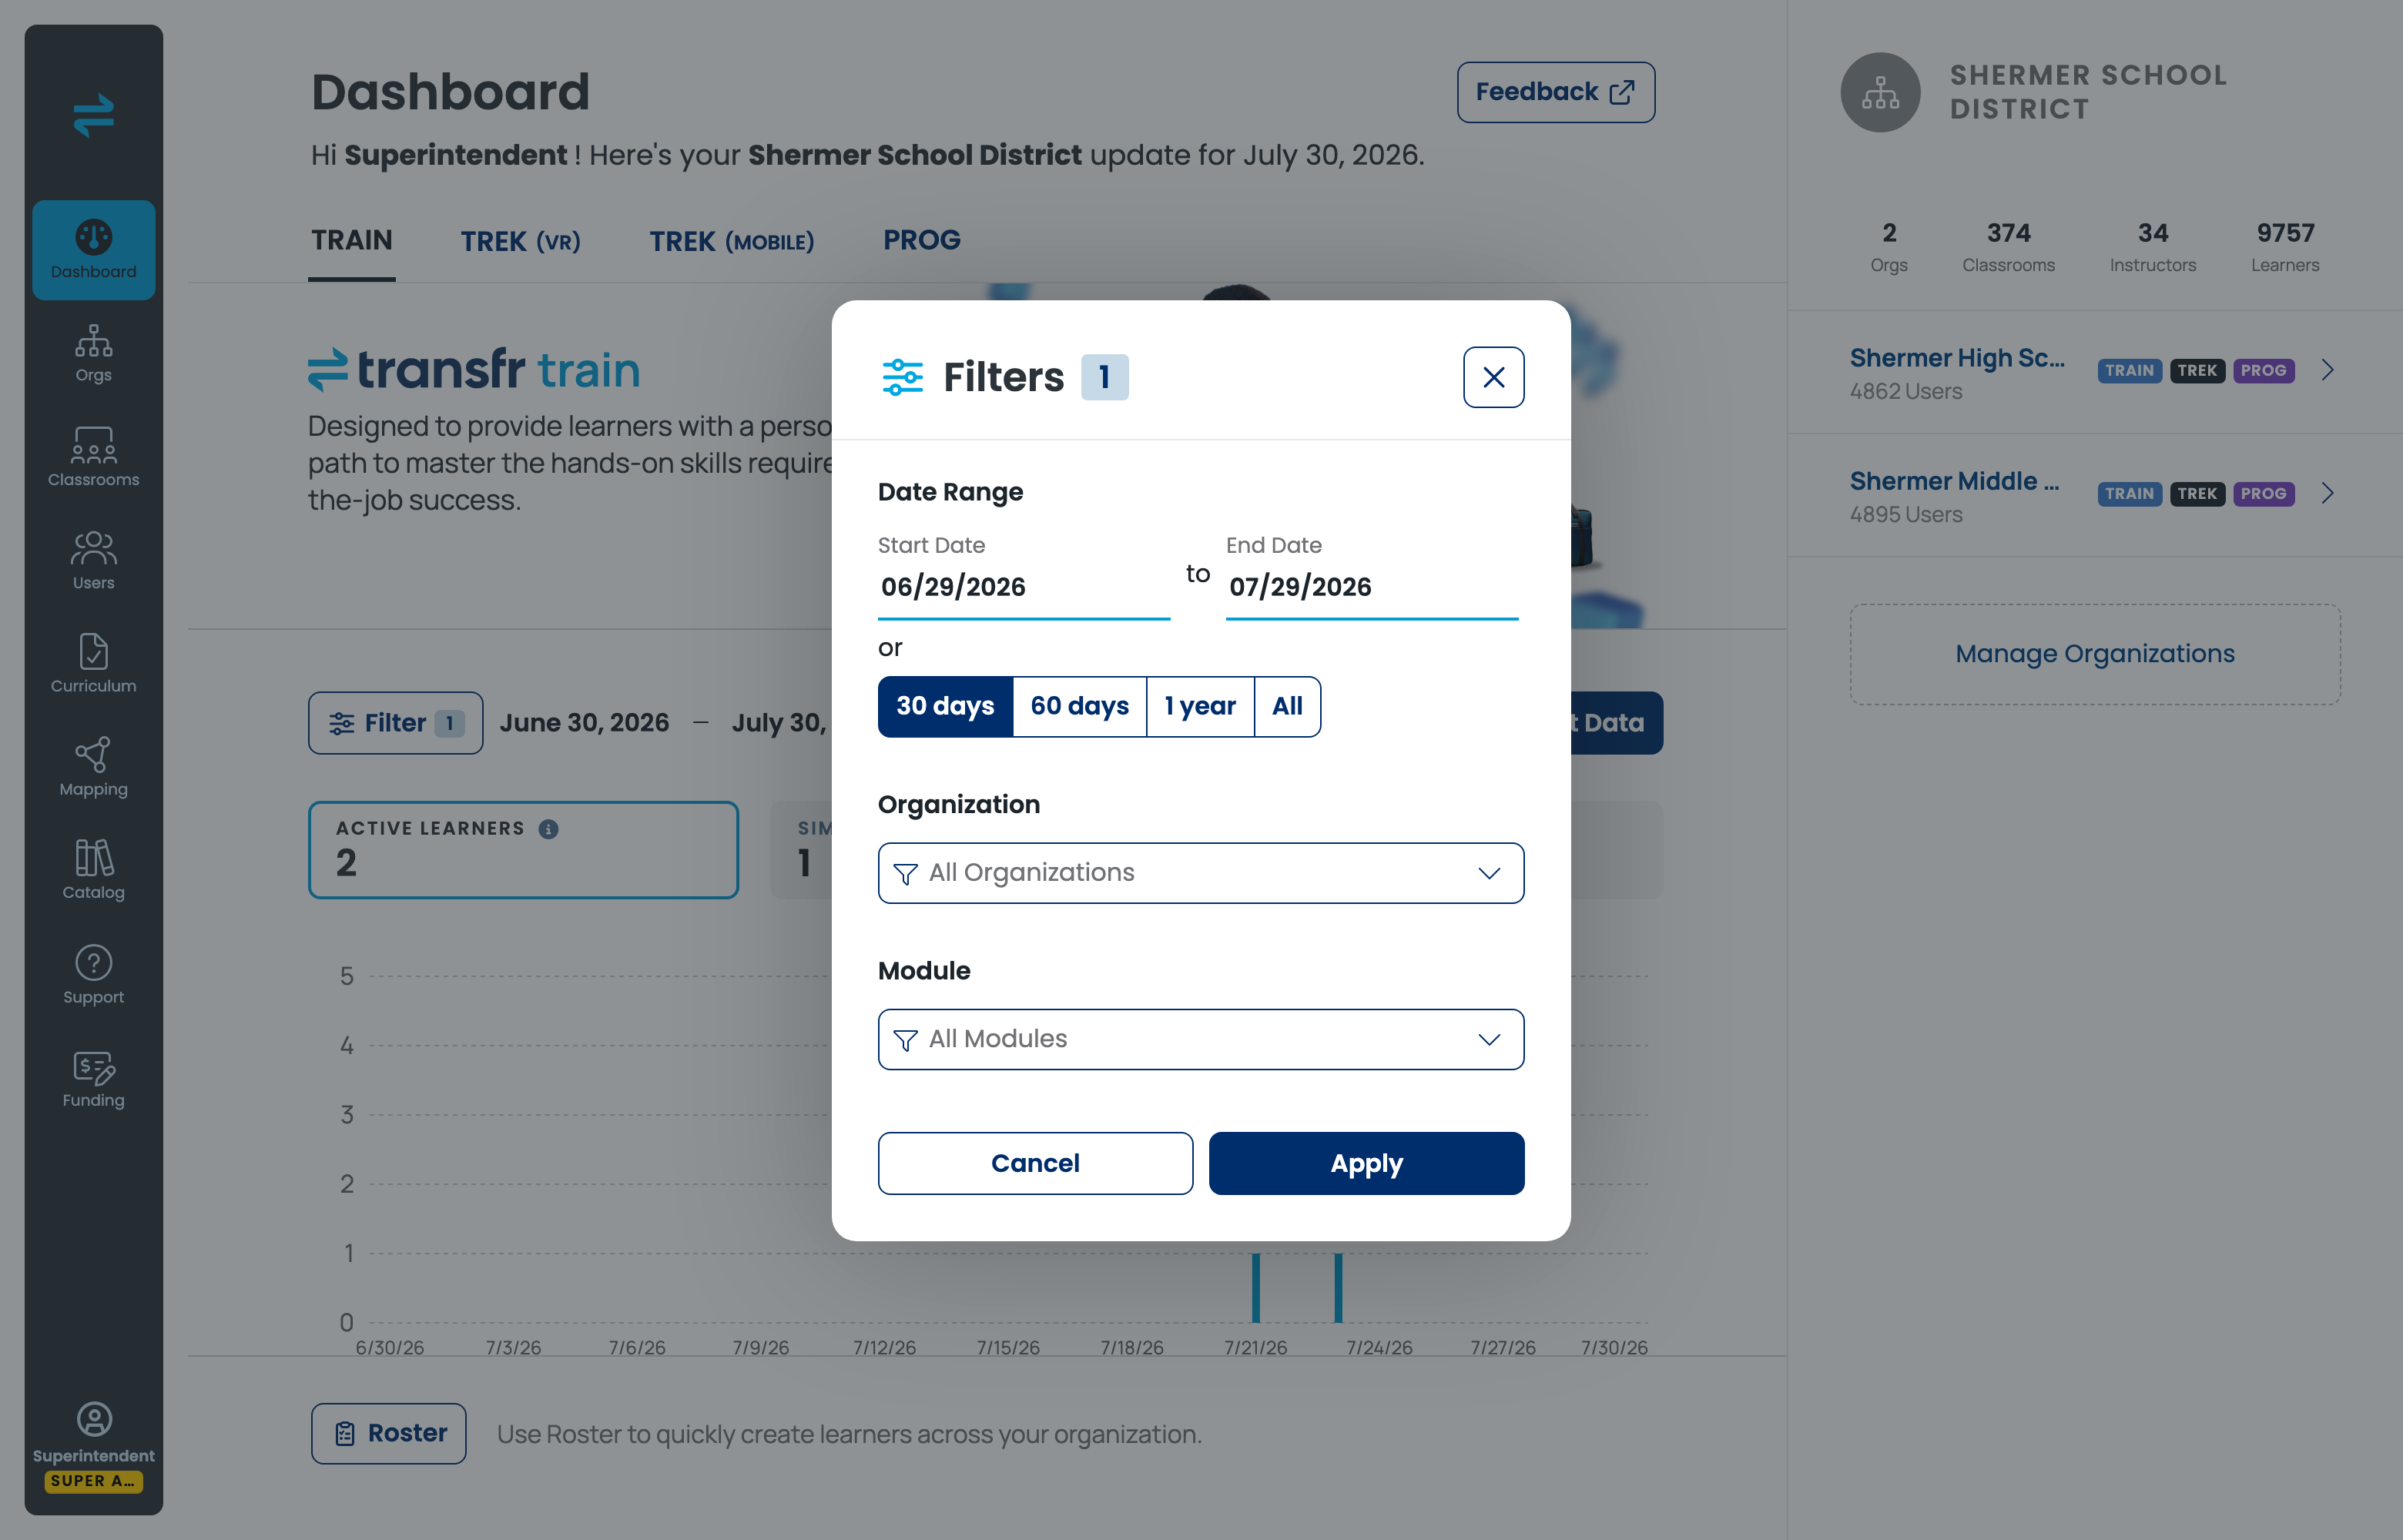
Everything on the Dashboard page respects the date range shown above the tiles. Select Filter to change it. The default range is the last 30 days, so a number that looks low is often a date-range question rather than a usage question — widen the range before drawing conclusions.
Reading a Train classroom's Progress tab
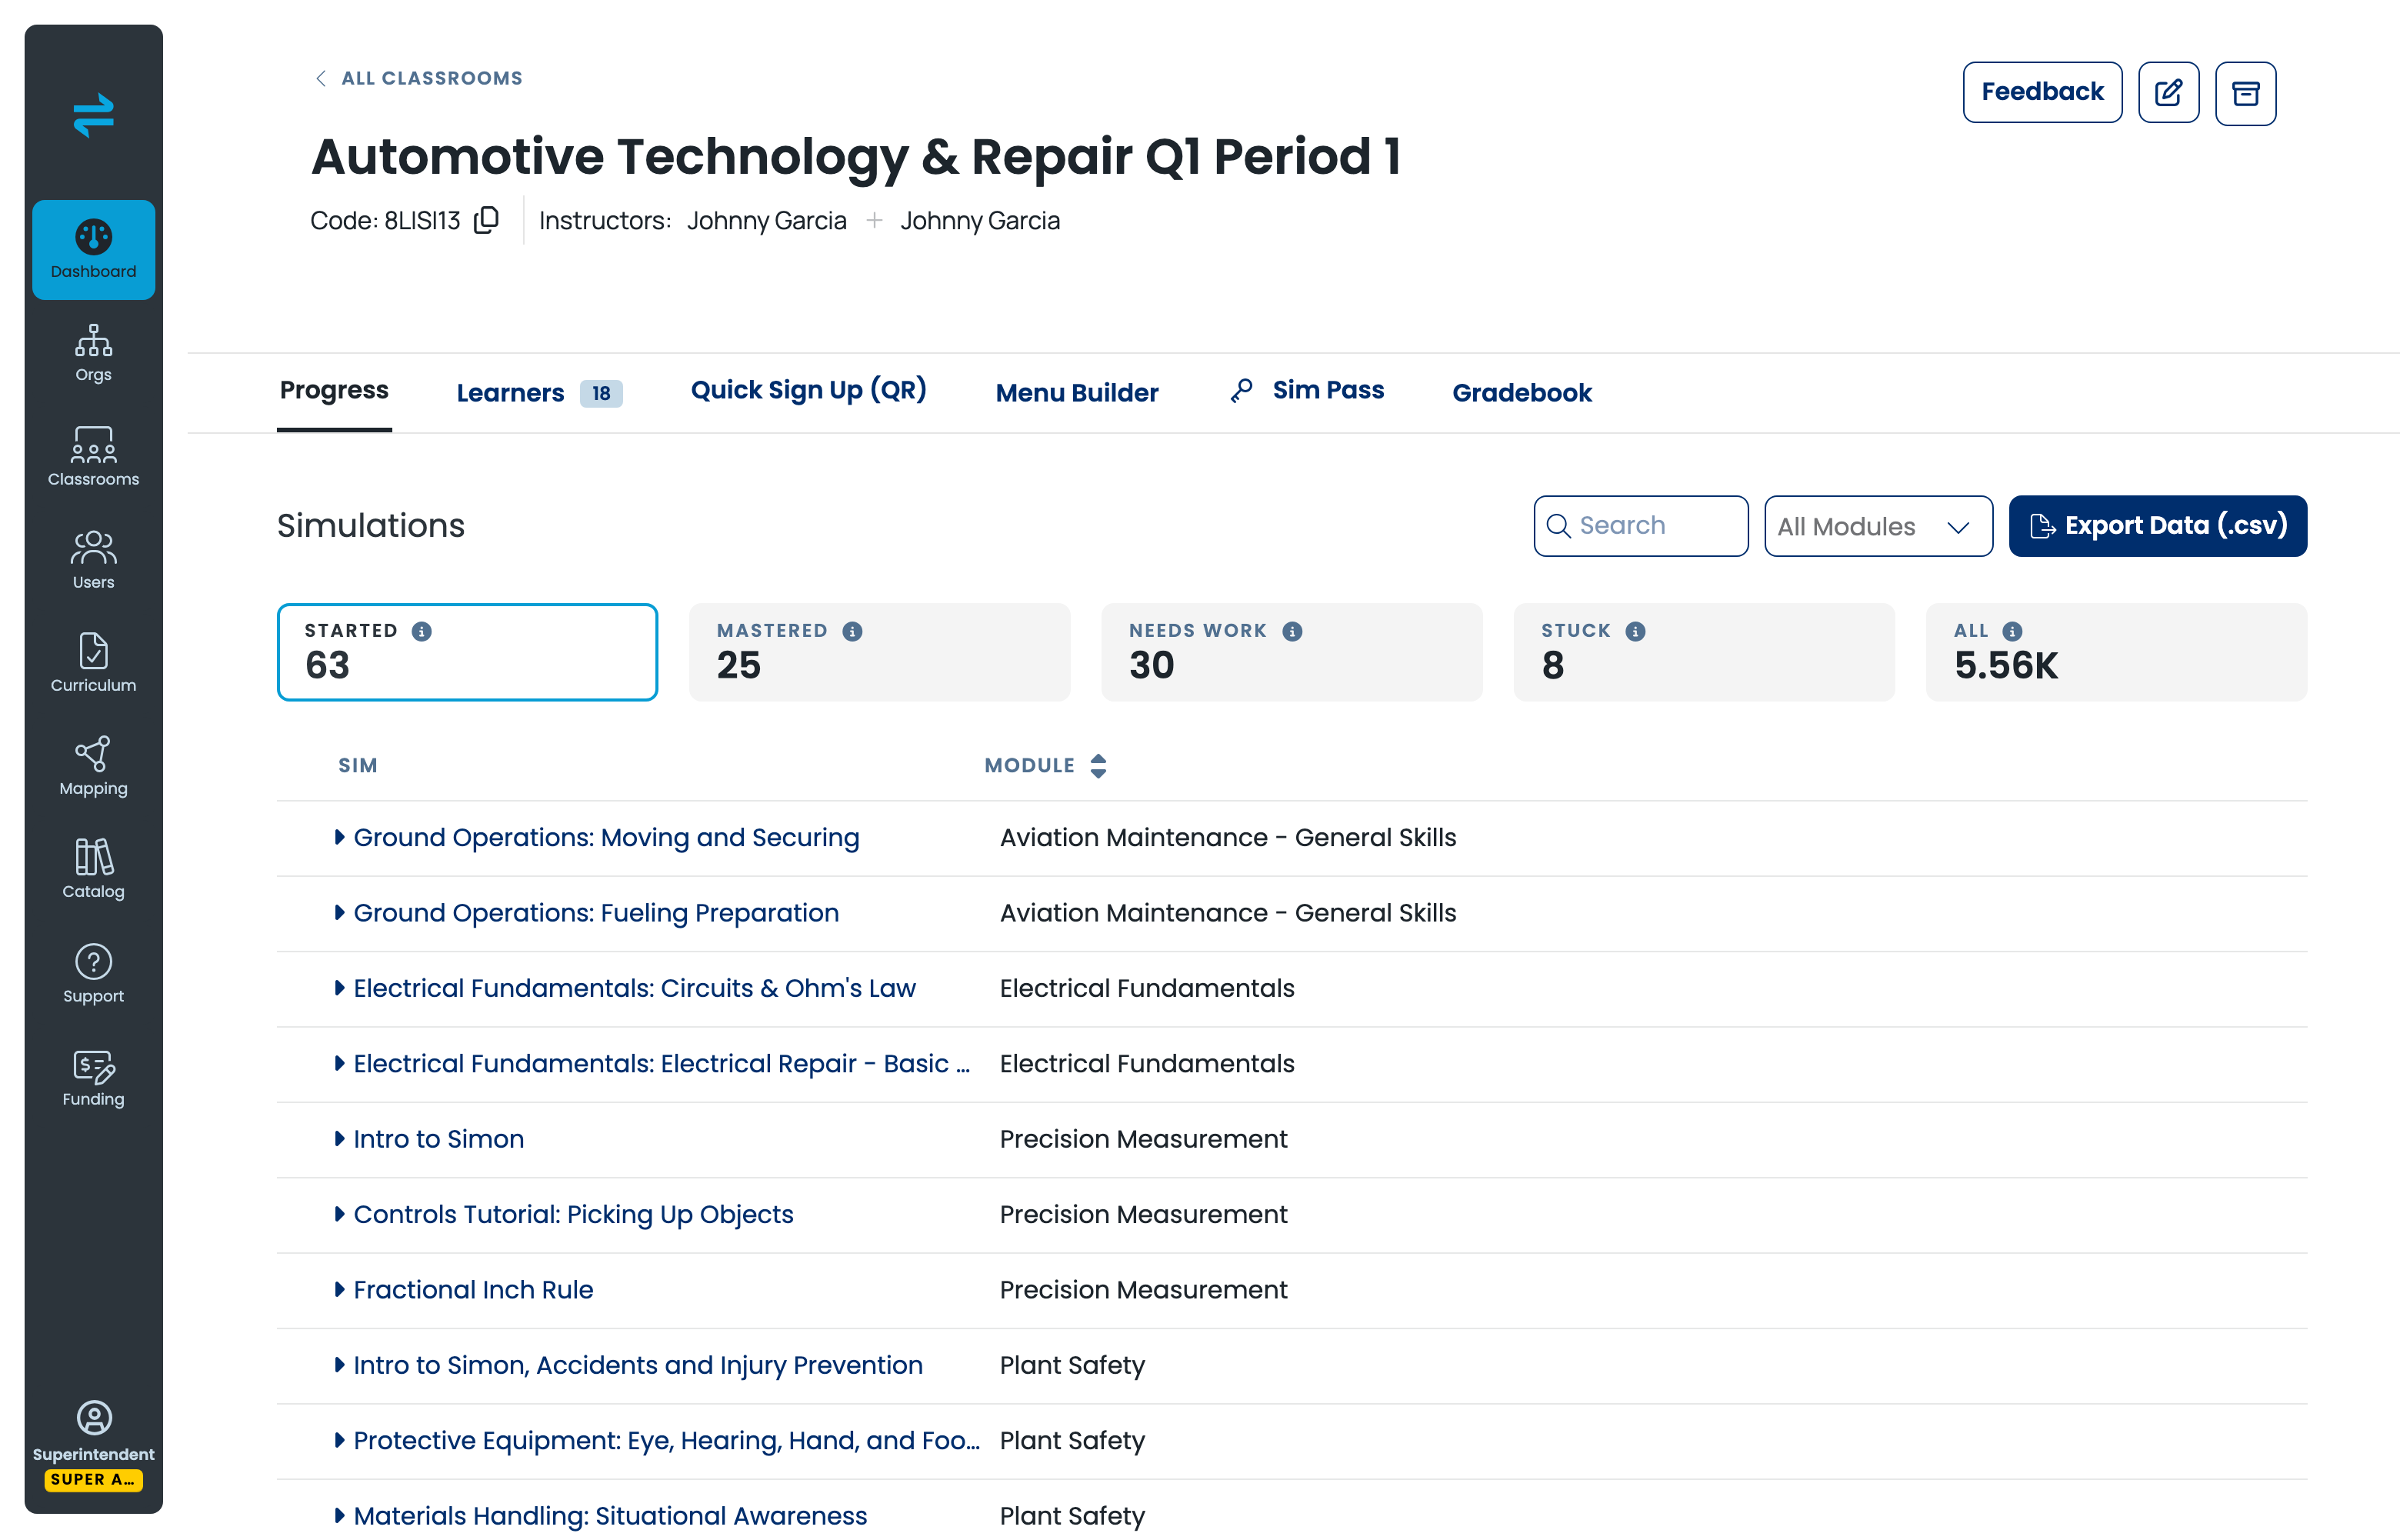
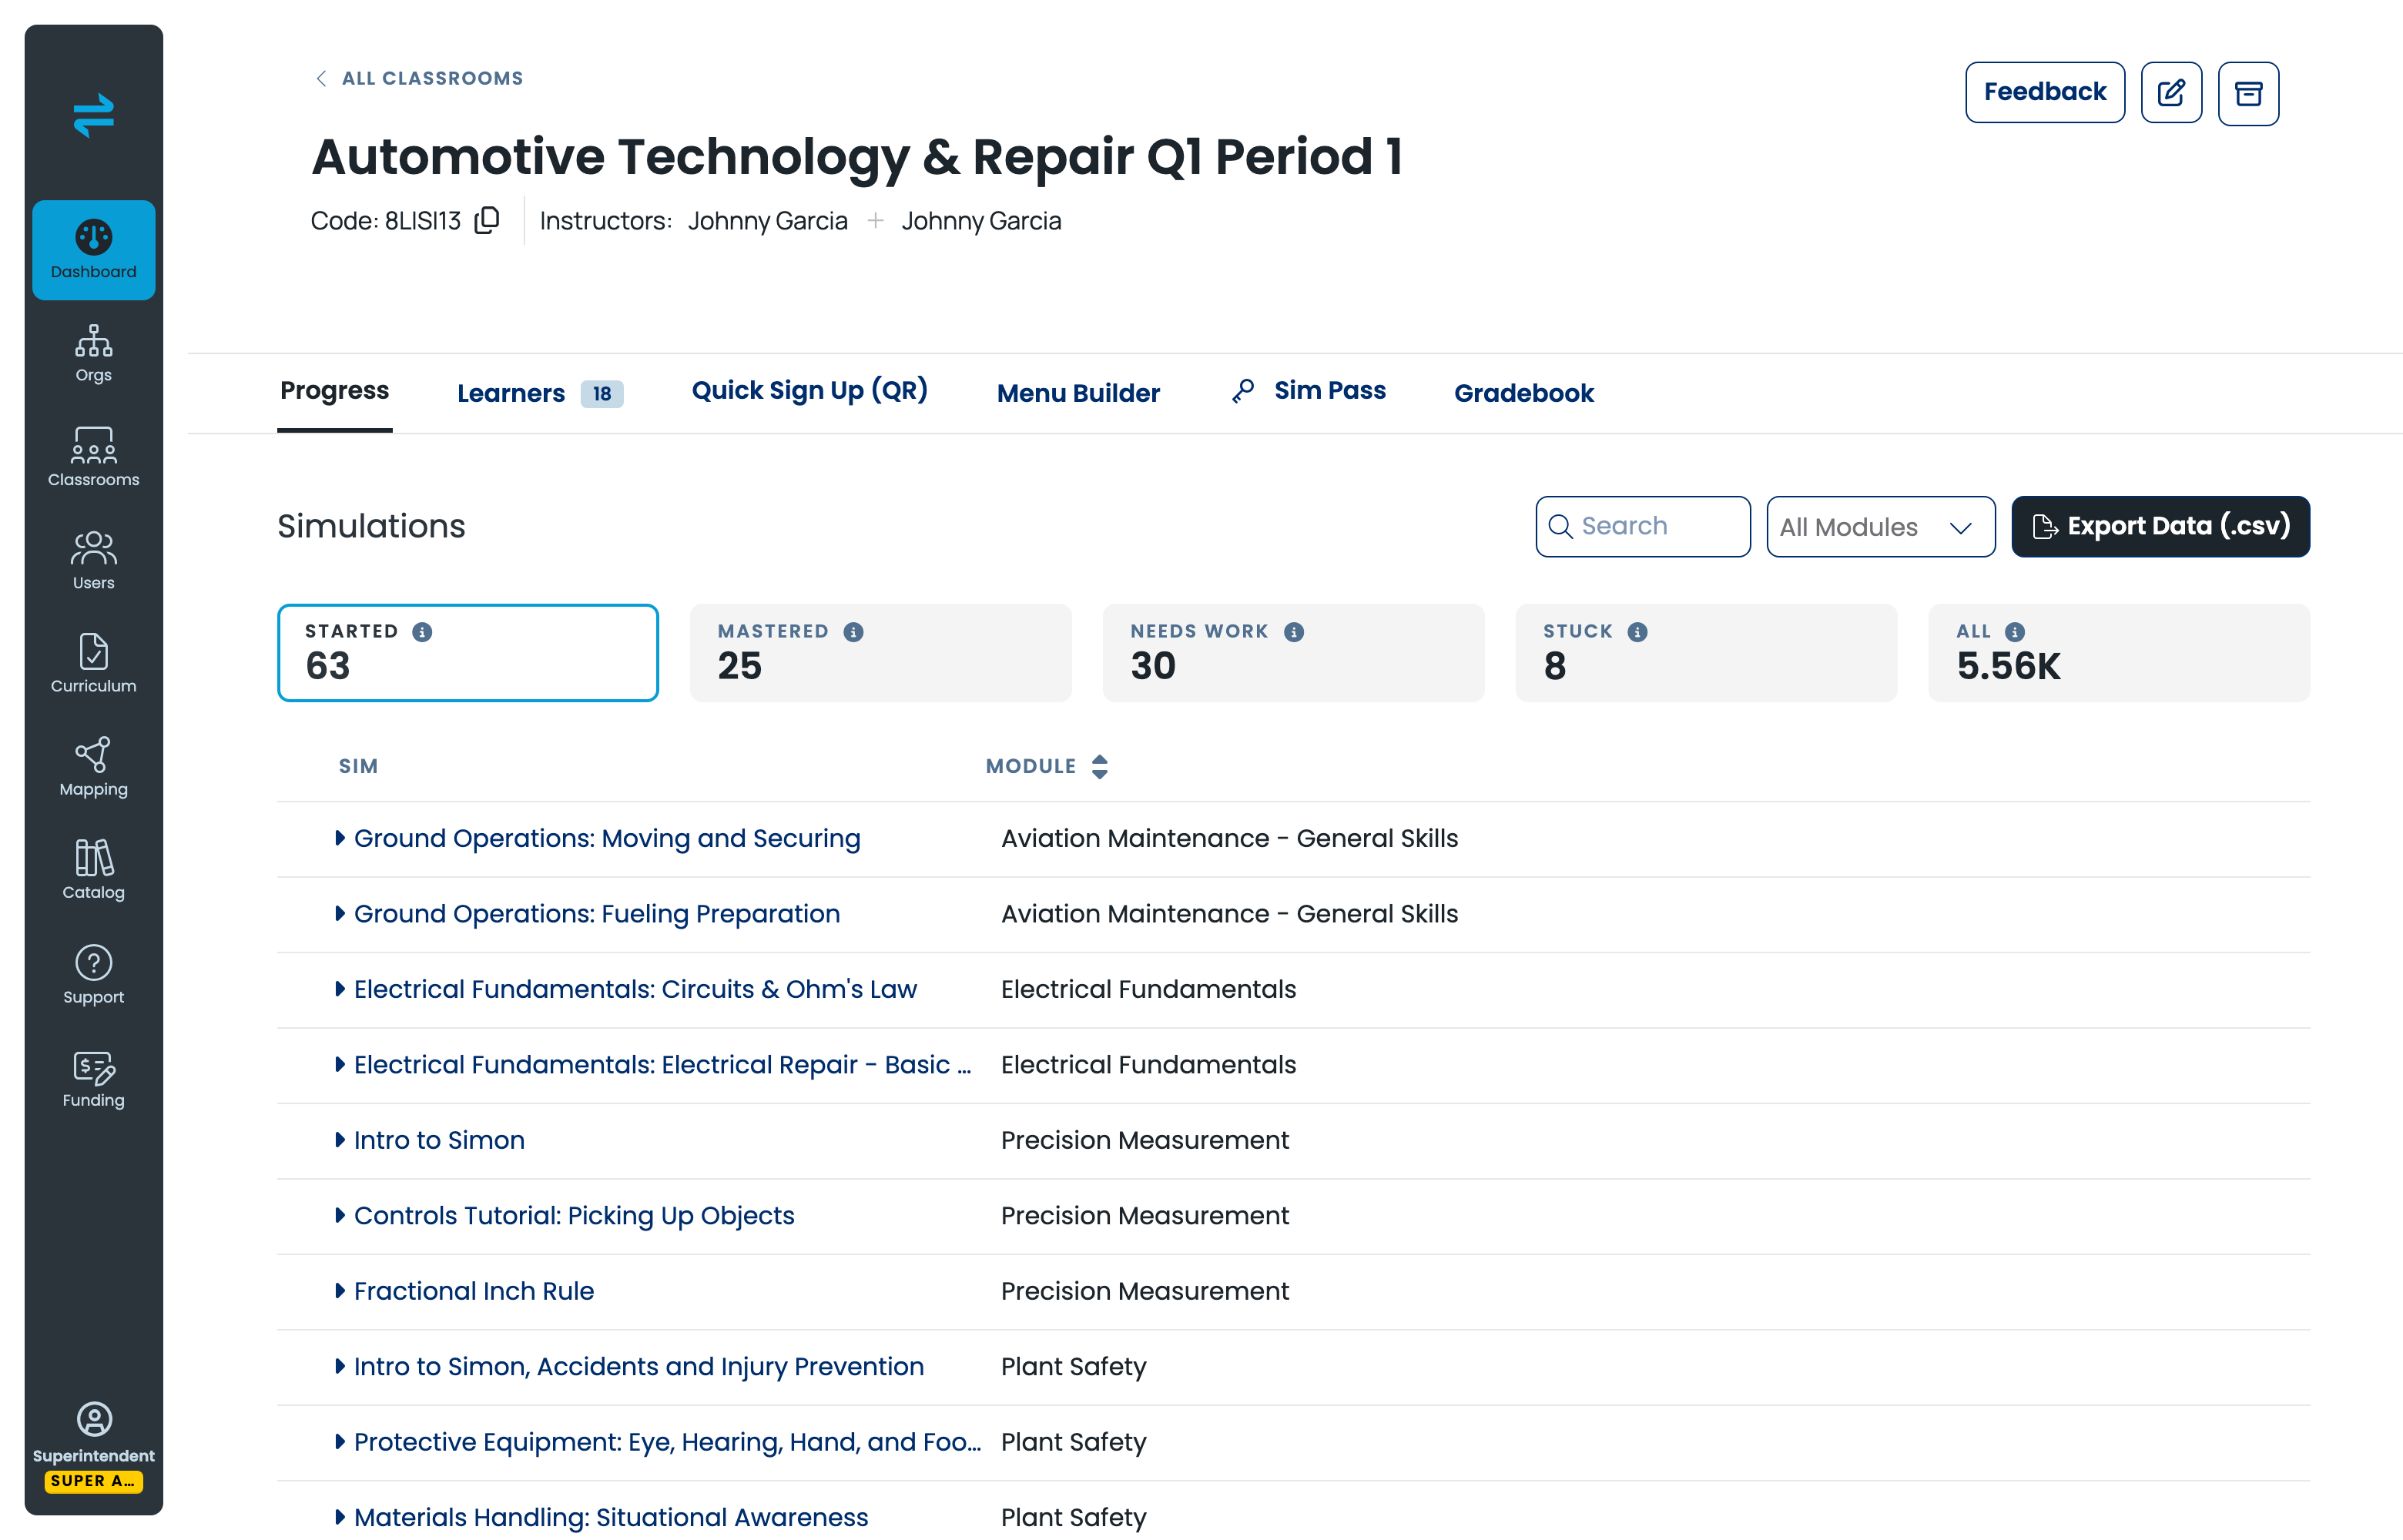
Open Classrooms, select a classroom, and stay on the Progress tab. For a Train classroom you'll see a Simulations list with these tiles above it:
- STARTED — simulation attempts begun
- MASTERED
- NEEDS WORK
- STUCK
- ALL
Each tile has an information icon next to it. Hover it for that metric's exact definition in the product — those definitions are the authoritative ones, and they're kept current in the app.
Selecting a tile filters the list below it. The list has two columns, SIM and MODULE, and each row expands to show per-learner detail. Use Search to find a simulation by name, or the All Modules dropdown to narrow to one module.
Reading a Trek classroom's Progress tab
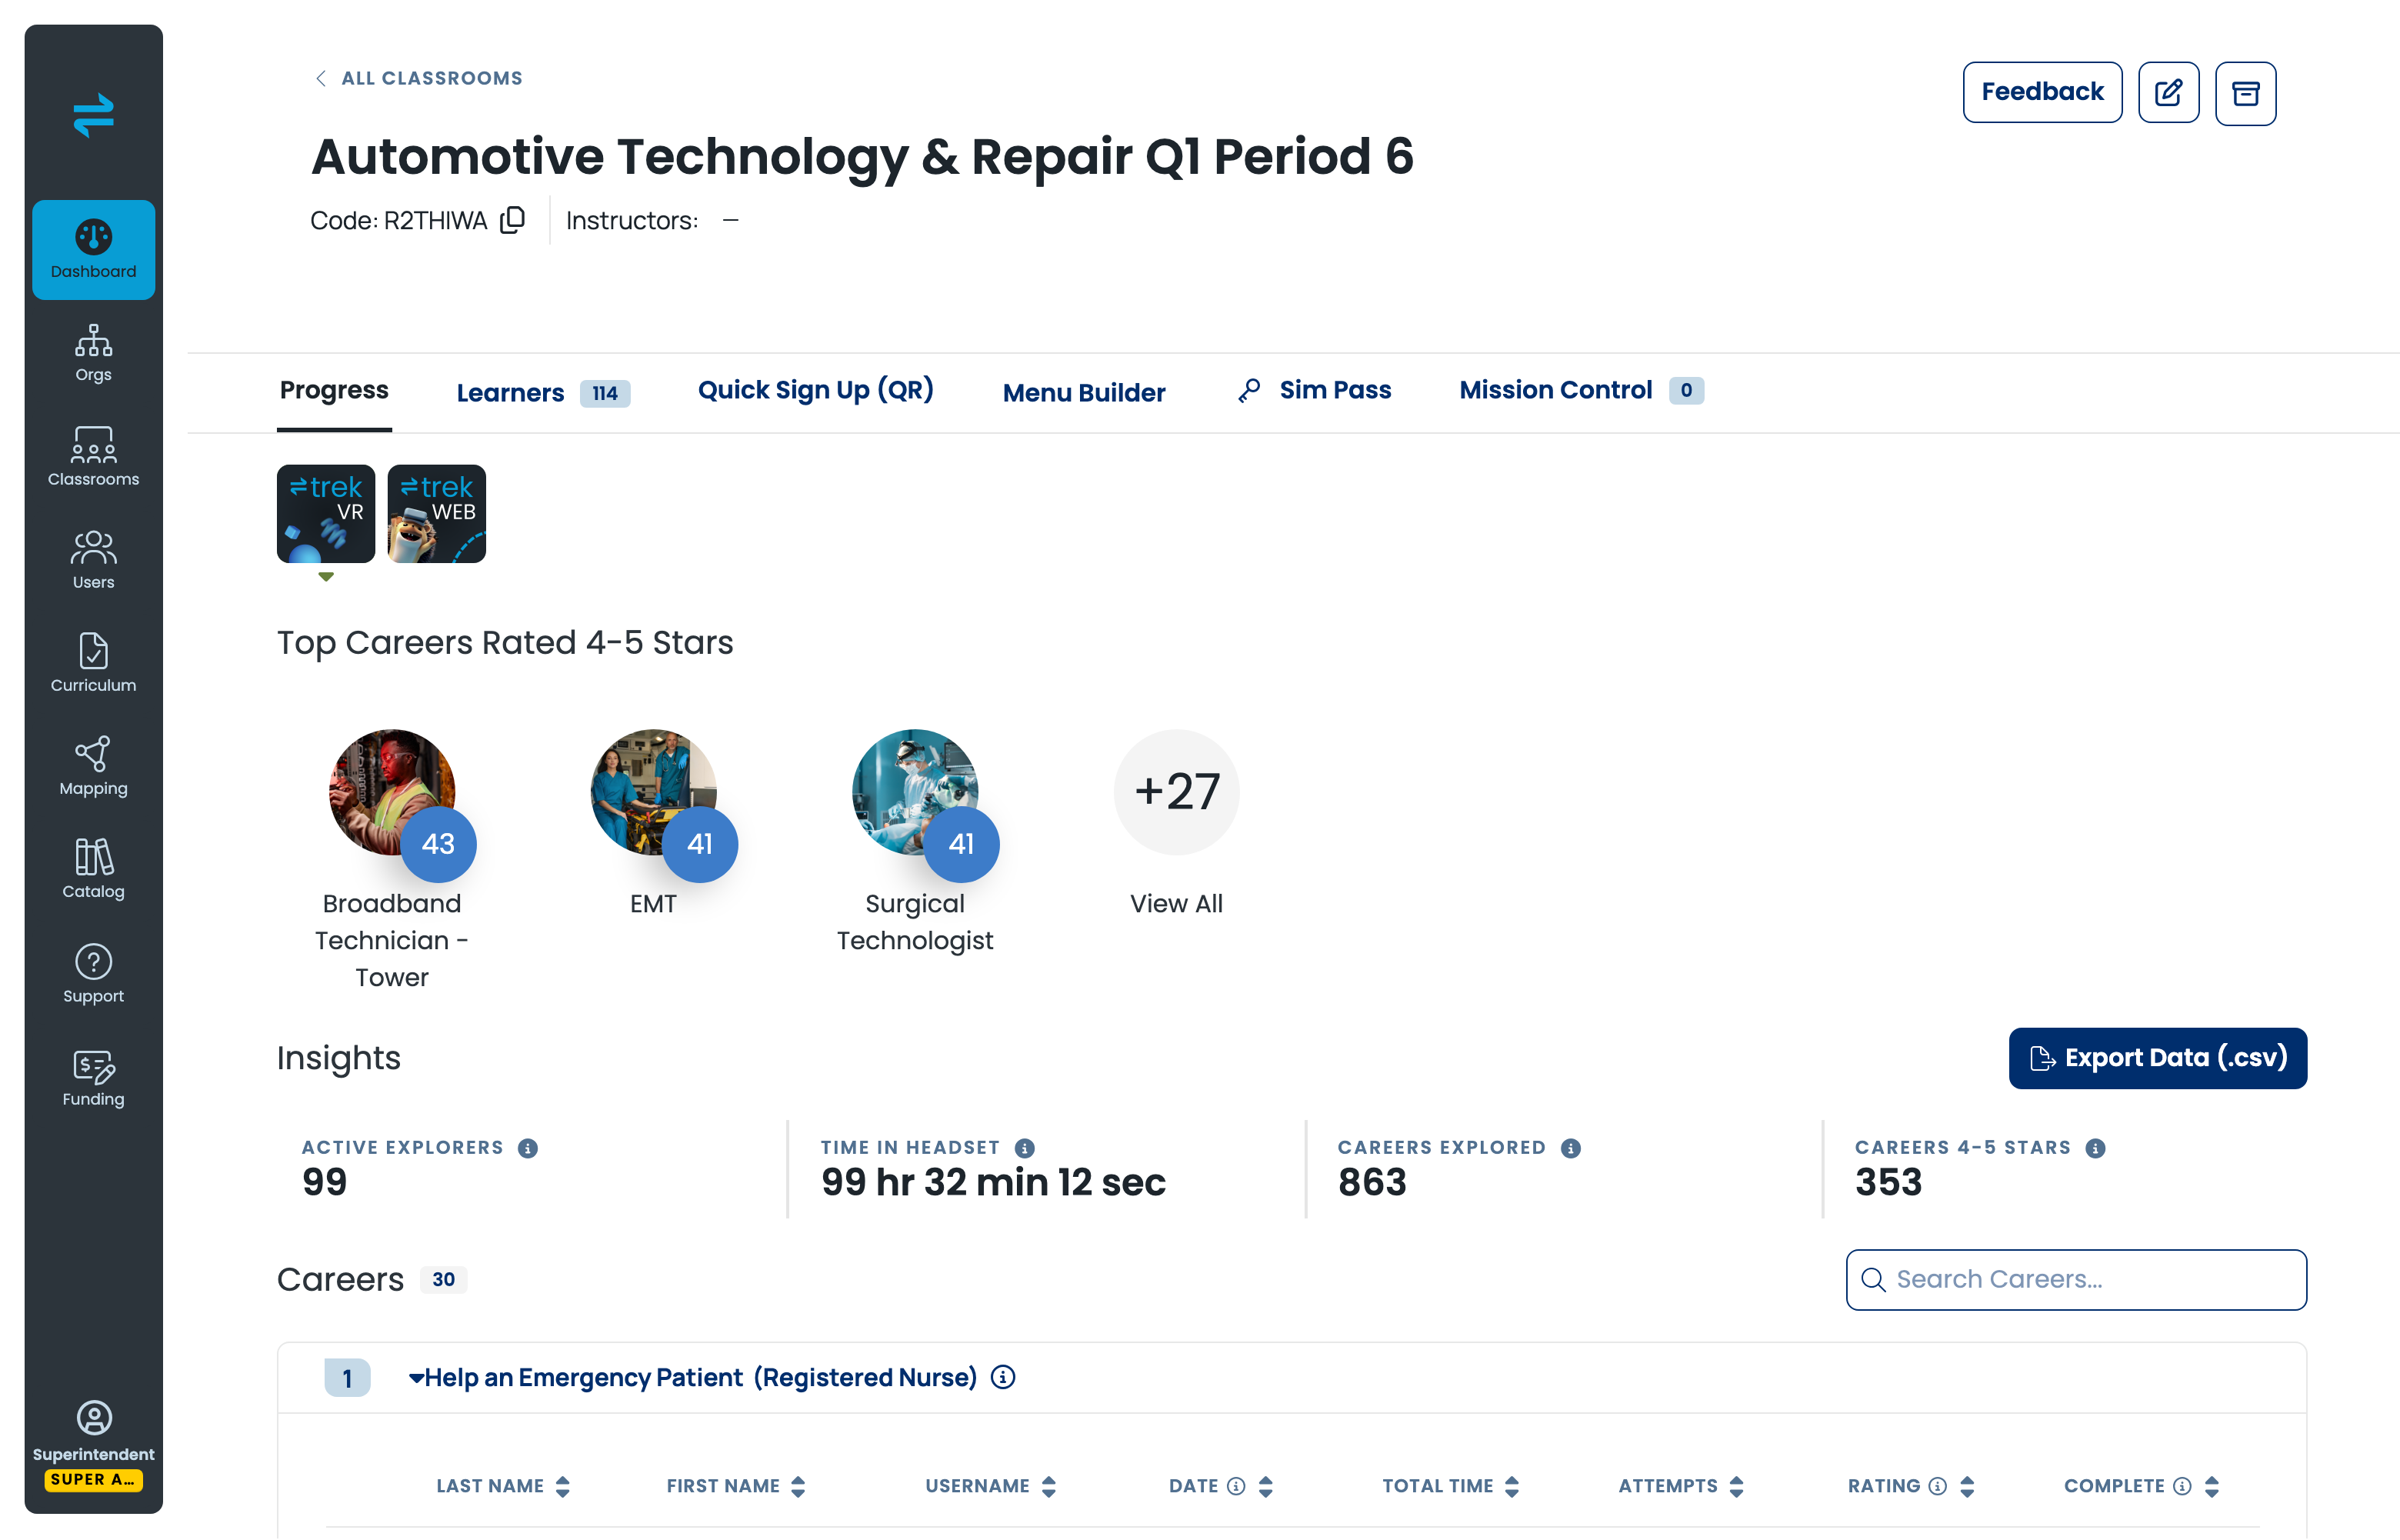
A Trek classroom's Progress tab is built around career exploration rather than skill mastery, so it shows different numbers. At the top is Top Careers Rated 4-5 Stars — the careers this classroom rated highest — with View All for the full list.
Below that, an Insights section with four tiles:
- ACTIVE EXPLORERS
- TIME IN HEADSET
- CAREERS EXPLORED
- CAREERS 4-5 STARS
Use the Trek (VR) and Trek (Mobile) controls to switch between headset activity and mobile activity. The learner table below carries the columns LAST NAME, FIRST NAME, USERNAME, DATE, TOTAL TIME, ATTEMPTS, RATING, and COMPLETE.
Using the Gradebook
The Gradebook tab appears on Train and Programs classrooms. It's a grid: one row per learner, one column per simulation, with the learner's result in each cell.
The Gradebook always shows one module at a time. The module currently in view is named above the grid, and you change it with Filters. This trips people up — a grid full of empty cells usually means the filter is on a module the class hasn't started, not that data is missing. Switch modules before reporting a problem.
Exporting to a CSV file
There are two exports, and they return different things.
From a classroom: on the classroom's Progress tab, select Export Data (.csv). This exports that classroom's simulation data.
From the Dashboard page: select Export Data next to the date filter. This exports at the organization level, for the product tab and date range you currently have selected.
Two things to check before you export from the Dashboard page:
- The product tab. The export follows the tab you're on, so a TRAIN export won't contain Trek activity.
- The date range. The export follows the Filter range, not all time.
Files download through your browser, so they land wherever your browser saves downloads.
If the numbers look wrong
Most reporting questions come down to one of these:
- The date range is too narrow. Widen it with Filter.
- You're on the wrong product tab. Trek and Train activity are counted separately.
- The Gradebook is filtered to a different module. Change it with Filters.
- Learners used a different account. Check the roster on the classroom's Learners tab, and see How do I add and manage learners?
- The classroom was archived. Archived classrooms are excluded from some views — see Archiving Classrooms and Learners.
If none of those explain it, contact Transfr Technical Support with the classroom name, the date range you used, and what you expected to see.
Who can see which reports
What's visible depends on the user's role. Super Admins see organization-wide data across every child organization; Admins, Instructors, and Reporters see progressively narrower slices. For how roles are assigned, see How do I add, edit, or remove users?
